Data engineering and SQL
Valencia Air Quality Lakehouse
Turns a large, wide municipal CSV into a documented analytical warehouse without hiding coverage gaps or range-screen warnings.
Measured project results
- station-hour rows in snapshot
- 449k
- long-format measurements
- 6.04M
- publisher station labels
- 12
- versioned metrics
- 22
Metrics come from the committed reproducible run in the linked repository. Their interpretation and limits are documented below.
Architecture
System flow and reviewable outputs.
- 01
Official 47.9 MB CSV
- 02
Source contract and SHA-256 manifest
- 03
Typed DuckDB staging
- 04
Dimensions and 6.04M fact rows
- 05
Observability SQL marts
- 06
API and dashboard
Reviewable artifacts
- Source contract
- Dimensional model
- SQL quality marts
- FastAPI
- Docker
- Tests and CI
Technology stack
- Python
- DuckDB
- SQL
- FastAPI
- Streamlit
- Docker
Question
What the project investigates.
Public environmental data often arrives as a large wide CSV. The project asks how to make it reusable for analysis while keeping source provenance, completeness and suspicious values visible rather than silently cleaning them away.
Approach
Method, in order.
- 01
Stream the official source with an atomic download, HTTP metadata and a SHA-256 manifest while keeping the raw 47.9 MB CSV out of Git.
- 02
Validate Spanish source headers and a reviewed metric catalog before loading a typed DuckDB staging table.
- 03
Build station, calendar and metric dimensions, then unpivot the source into a 6.04 million-row long measurement fact through versioned SQL.
- 04
Materialize coverage, completeness, daily trends, monitoring-gap and range-screen marts for analysts, an API and an interactive dashboard.
- 05
Exercise the same transformation against a labelled synthetic fixture in pytest and GitHub Actions, including a Docker build.
Evidence
Results with context.
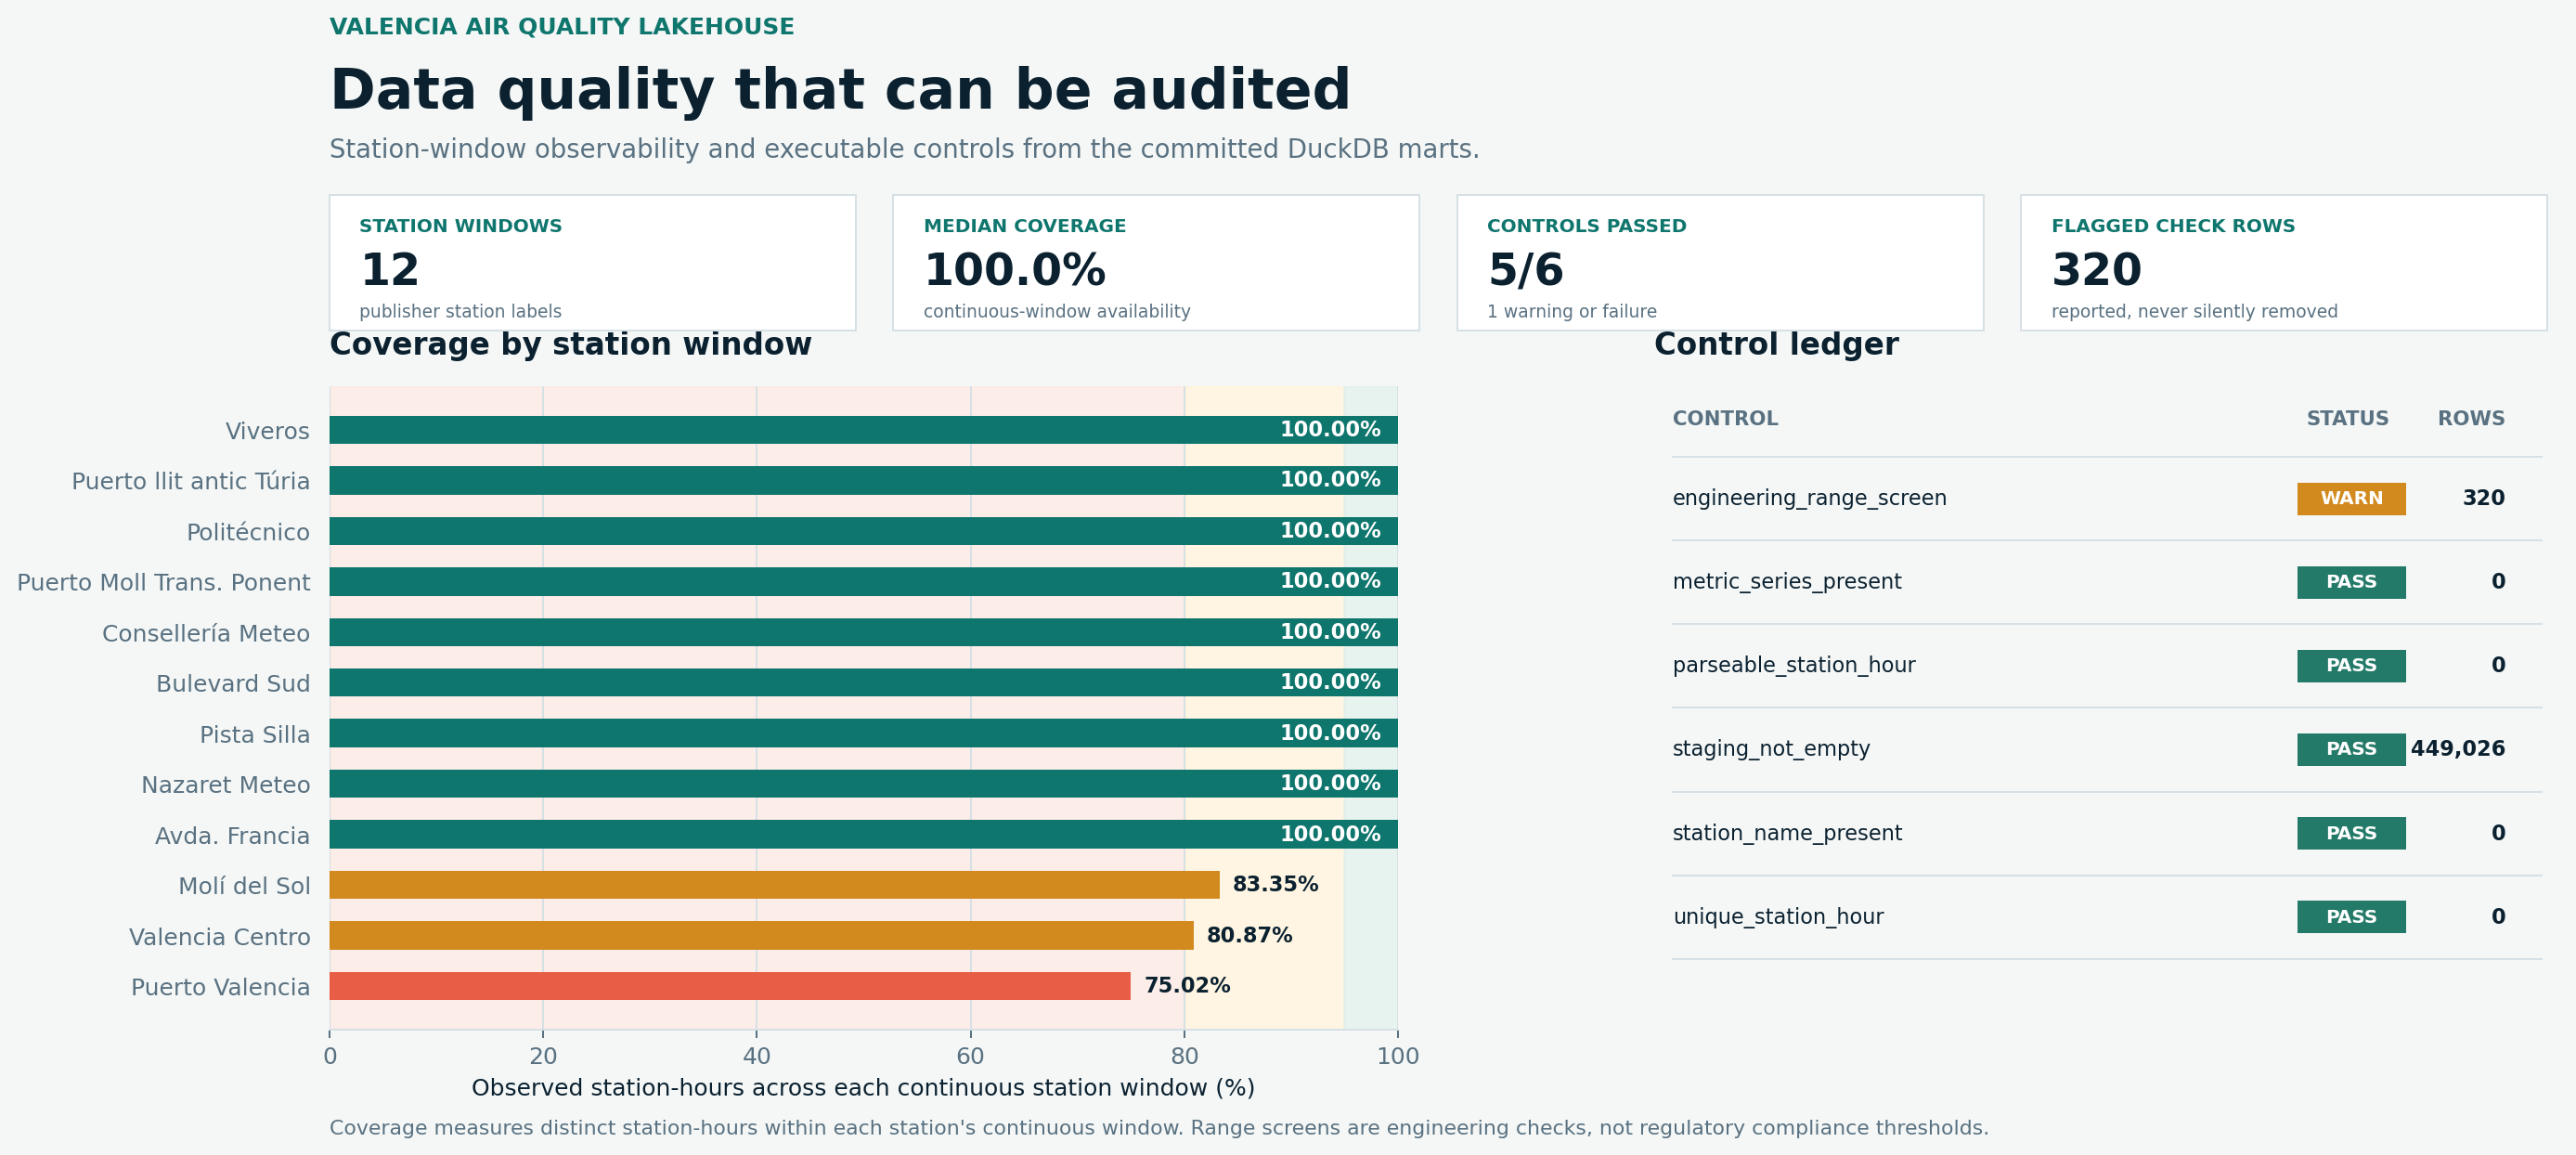
- The committed 2026-07-13 source manifest records a 449,026-row snapshot from 2016-01-01 through 2021-12-31, across 12 publisher station labels and 22 metrics.
- Four hard source controls pass: rows are nonempty, station-hours parse, station labels exist and no duplicate station-hour keys are found.
- One warning is explicit rather than suppressed: 320 values fall outside broad engineering ranges, split across radiation (198), humidity (63) and noise (59).
Quality controls
How the work can be reviewed.
- The project stores a source hash and concise manifest without publishing the raw CSV or local warehouse.
- Range screening is materialized as its own SQL mart and API response, so data-quality uncertainty remains inspectable.
- Ruff, pytest, dependency checks, a fixture rebuild and a Docker build pass in GitHub Actions.
Limits
What the output is not.
- The warehouse is a reproducible snapshot, not a live municipal monitoring service.
- Range screens are engineering controls, not legal thresholds or health guidance.
- Published coverage does not prove sensor calibration, scientific validity or the cause of observed changes.