Operations research and mobility
Valenbisi Pulse
Turns a static bike-sharing snapshot into an auditable operations review, while clearly separating simulation from prediction.
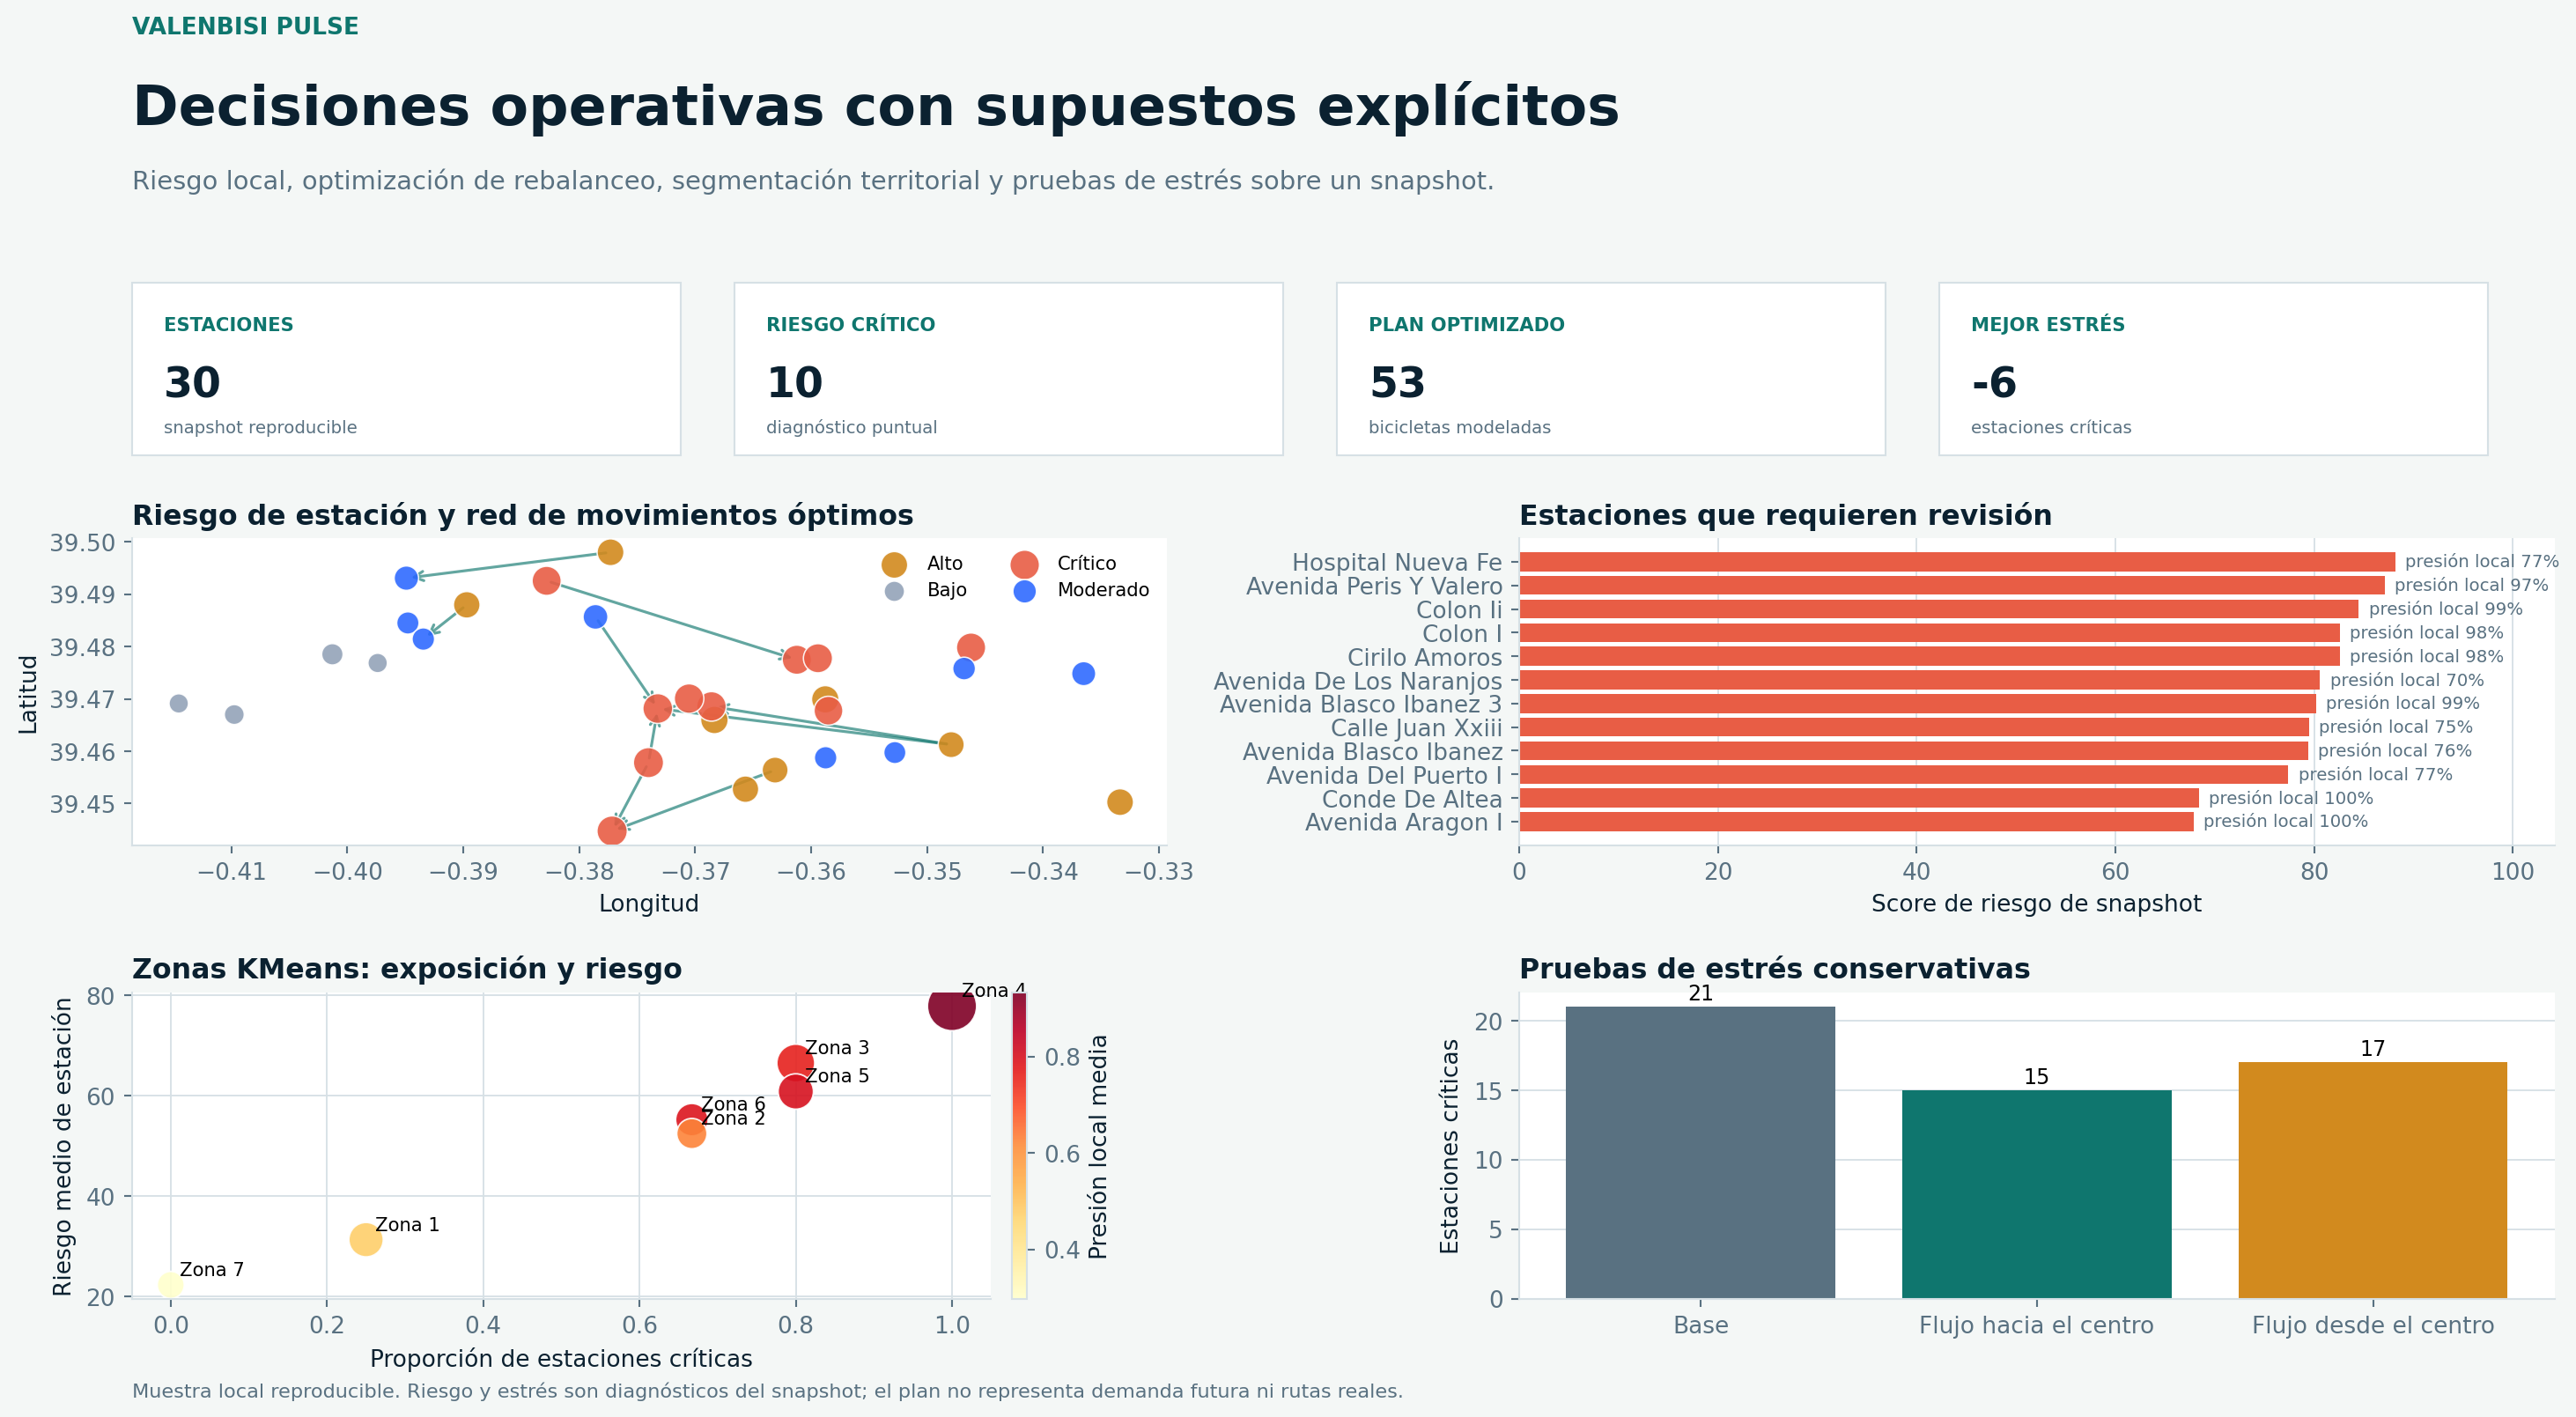
Measured project results
- stations in reproducible sample
- 30
- critical stations at base thresholds
- 21
- bikes assigned / modeled need
- 53 / 152
- bike-km in LP transport plan
- 91.28
Metrics come from the committed reproducible run in the linked repository. Their interpretation and limits are documented below.
Architecture
System flow and reviewable outputs.
- 01
Versioned CityBikes snapshot
- 02
Inventory and geospatial validation
- 03
k-NN pressure and KMeans zones
- 04
Minimum-cost LP rebalancing
- 05
Stress scenarios and dashboard
Reviewable artifacts
- Data validation
- Risk scoring
- Linear program
- Stress tests
- Streamlit dashboard
- Tests and CI
Technology stack
- Python
- SciPy
- scikit-learn
- KMeans
- Plotly
- Streamlit
Question
What the project investigates.
A total bike count hides operational risk: empty stations block departures and full stations block returns. The work turns a single snapshot into a constrained review of where intervention might be most valuable.
Approach
Method, in order.
- 01
Validate inventory, capacity, coordinates, duplicates and operational status before scoring.
- 02
Combine station state, imbalance, k-NN pressure and isolation in an auditable 0-100 snapshot risk score.
- 03
Aggregate local signals using reproducible KMeans analytical zones.
- 04
Solve a minimum-cost transport linear program with explicit maximum distance and unmet-need penalty.
- 05
Run deterministic core-periphery stress scenarios that conserve bikes across the network.
Evidence
Results with context.
- The model finds 7 eligible sources, 14 destinations and 49 arcs inside 2.5 km.
- Its transport plan assigns 34.9% of modeled need in the included sample, not a live operational recommendation.
- Two stress scenarios preserve the network bike total and are labeled as non-predictive.
Quality controls
How the work can be reviewed.
- Input controls and solver outputs are exported as CSV and JSON artifacts.
- Ruff, pytest and CI validate the dashboard import and sample artifact reconstruction.
- The decision model documents the objective, penalties and operational limits.
Limits
What the output is not.
- A snapshot cannot learn demand patterns or forecast future user behavior.
- Geodesic distance is not vehicle routing, travel time or staffing cost.
- Analytical zones do not represent administrative neighborhoods.