Forecasting and data platform
Spain Electricity Demand Forecast Lab
A full data-to-forecast workflow designed to make temporal assumptions, uncertainty and performance comparisons inspectable.
Measured project results
- daily demand observations
- 2,557
- expanding backtest windows
- 12
- test MAE reduction vs 7-day baseline
- 62.0%
- observed 95% interval coverage
- 94.2%
Metrics come from the committed reproducible run in the linked repository. Their interpretation and limits are documented below.
Architecture
System flow and reviewable outputs.
- 01
REE, ERA5 and holiday sources
- 02
Manifested ingestion
- 03
DuckDB analytical marts
- 04
Leakage-safe temporal features
- 05
Expanding-window backtests
- 06
Intervals and dashboard
Reviewable artifacts
- ETL manifests
- SQL marts
- Temporal backtests
- Prediction intervals
- Streamlit dashboard
- Tests and CI
Technology stack
- Python
- DuckDB
- SQL
- scikit-learn
- Plotly
- Streamlit
Question
What the project investigates.
The objective is a one-step daily forecast that compares simple seasonal baselines with feature-based models while protecting the final year from tuning and calibration decisions.
Approach
Method, in order.
- 01
Ingest demand, multi-city weather proxies and national holidays with manifests, retries and validation checks.
- 02
Load raw and modeled tables into DuckDB and build versioned analytical marts with SQL.
- 03
Create leakage-aware lags, rolling windows, calendar and climate features.
- 04
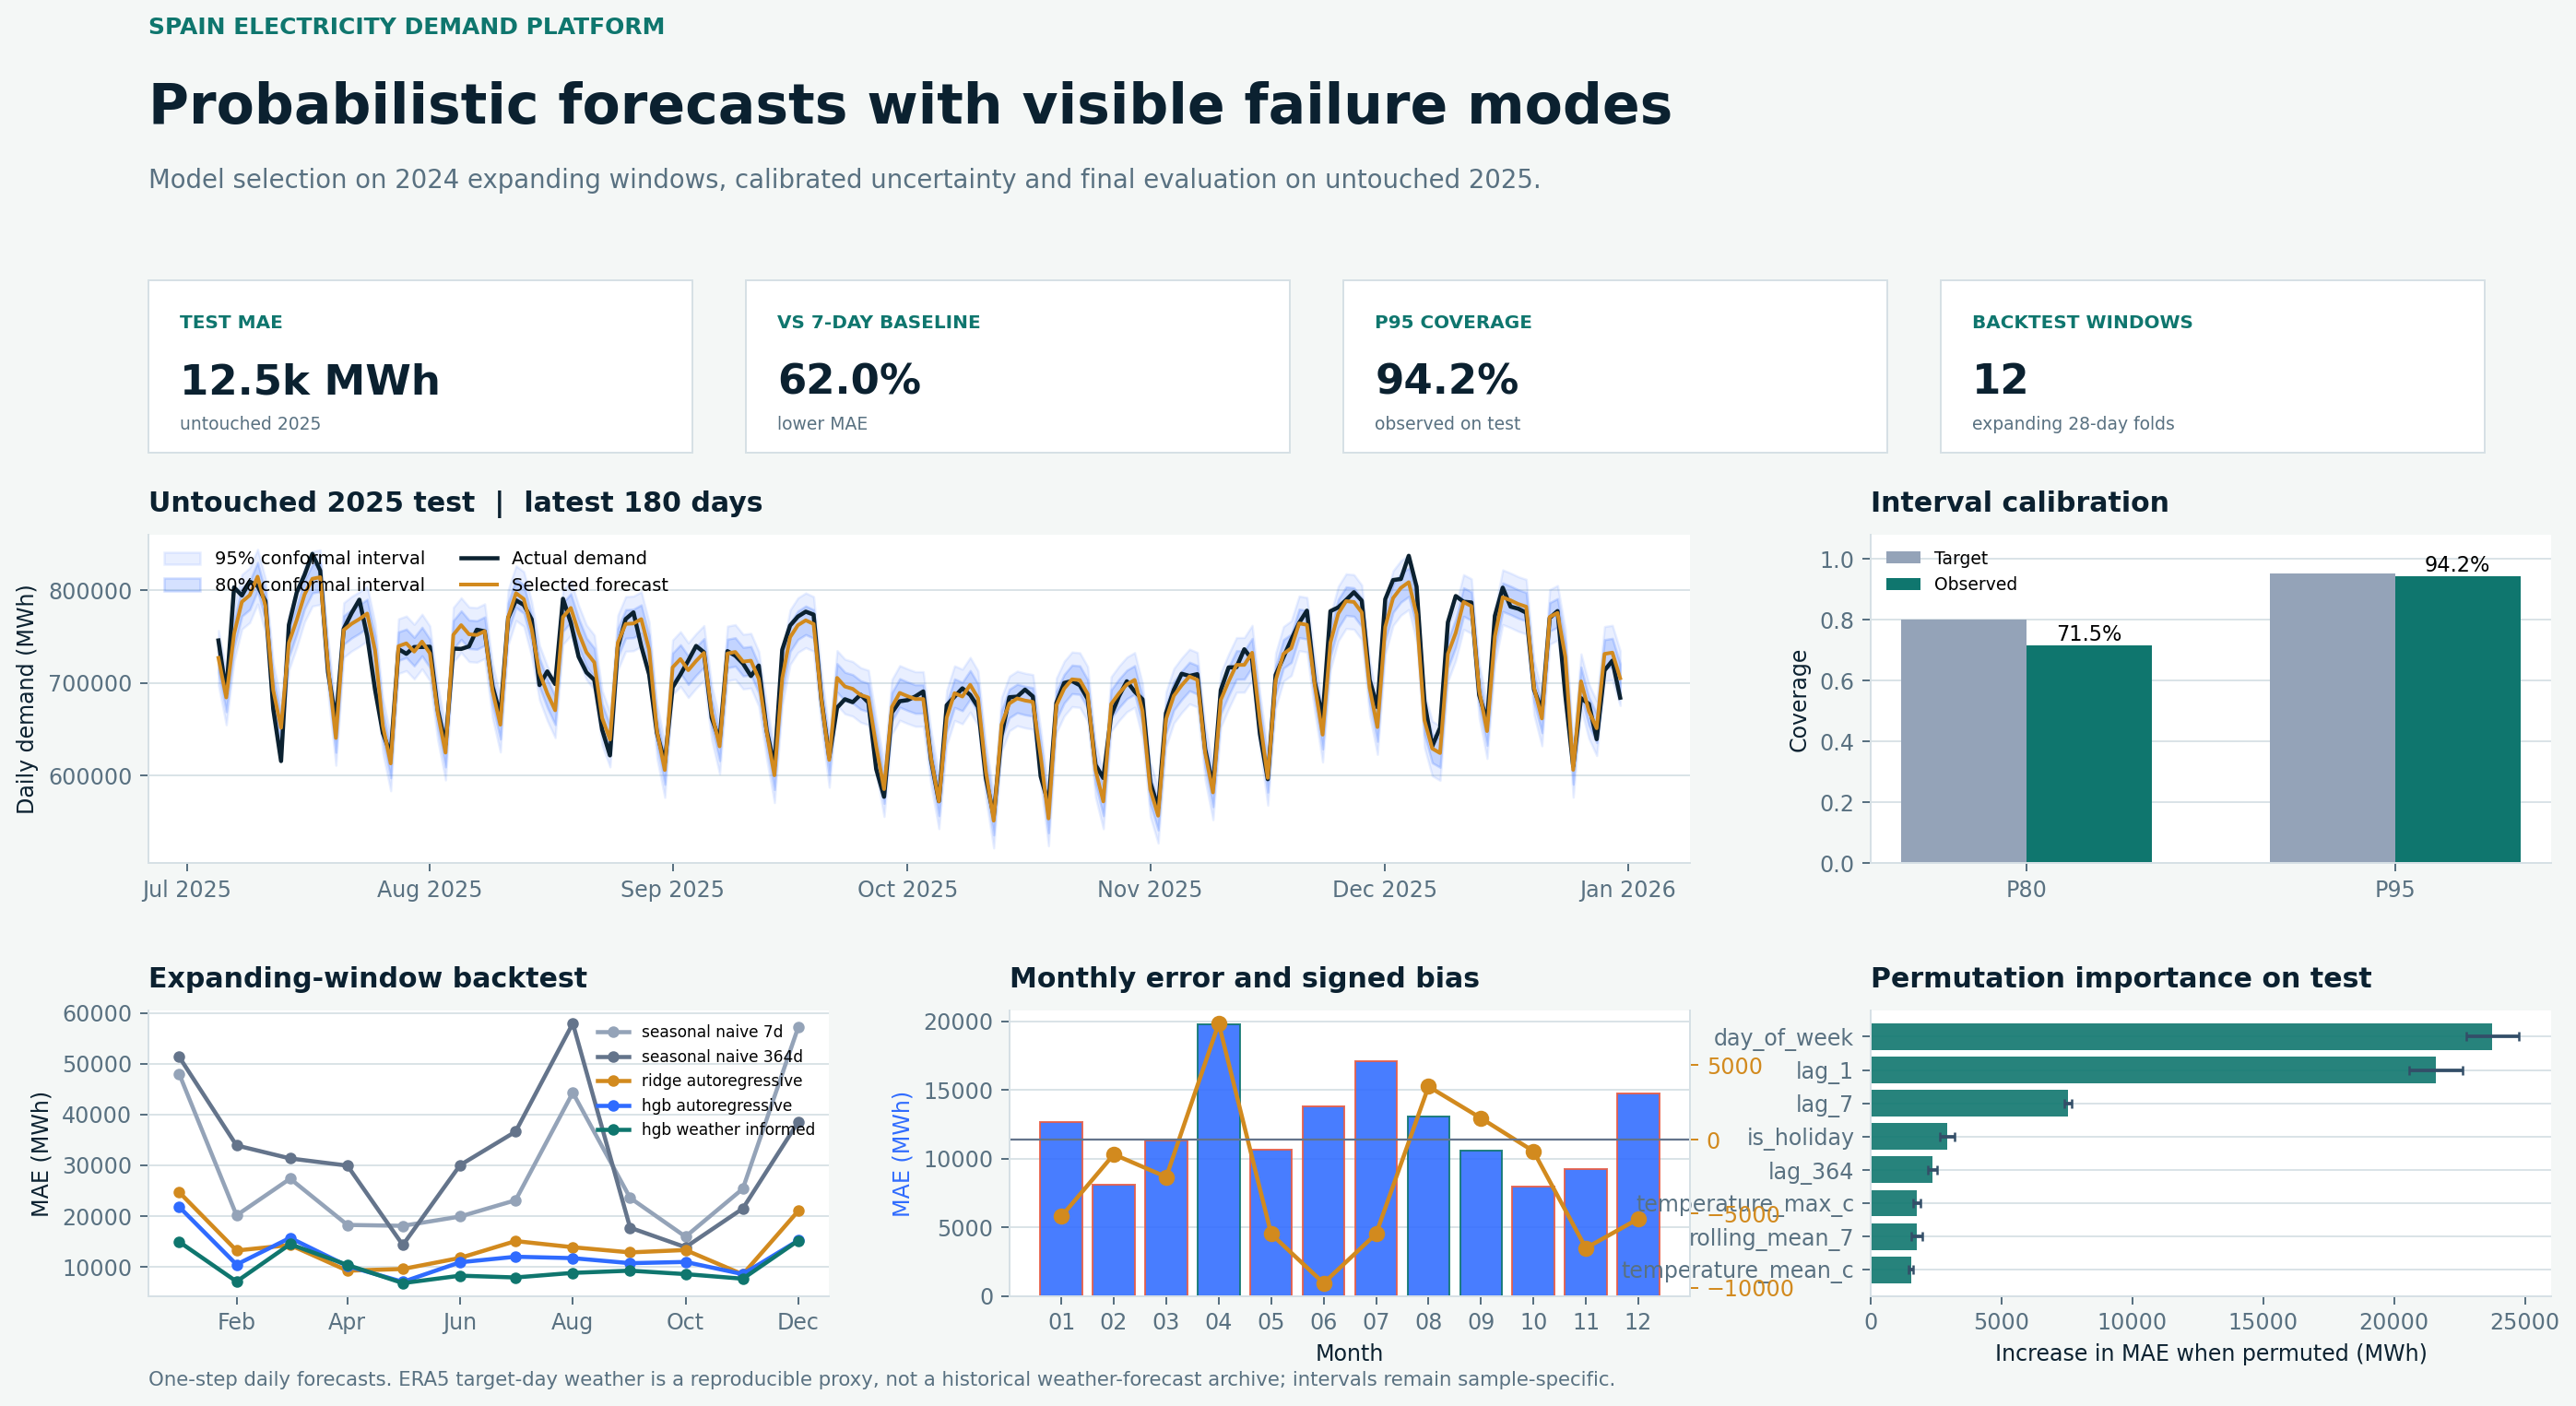
Evaluate five candidates over 12 expanding 28-day windows in 2024.
- 05
Estimate bias correction and conformal interval widths from out-of-sample residuals before touching 2025.
Evidence
Results with context.
- The selected weather-informed HGB model records 12,455 MWh test MAE in 2025 versus 32,816 MWh for the 7-day seasonal naive baseline.
- A weekly block bootstrap estimates a 20,361 MWh MAE advantage; the reported interval is tied to this specific sample.
- The 80% interval covers only 71.5% of the untouched test, a deliberately visible calibration limitation.
Quality controls
How the work can be reviewed.
- Quality checks cover continuity, duplicates, weather coverage and feature leakage.
- SQL marts, model registry, metrics and figures are regenerated by the pipeline.
- Ruff, pytest and GitHub Actions validate the platform.
Limits
What the output is not.
- The task is one-step-ahead forecasting, not recursive multi-week forecasting.
- Target-day ERA5 weather is a reproducible proxy, not a historical weather-forecast archive.
- Results are predictive associations, not operational dispatch advice.